
2023 Mid-Year Market Recap
Written by: The Investment Committee
From a West Coast regional banking crisis to the recession that never came, a tech rally fueled in part by an AI frenzy, and a better-than-anticipated Q1 earnings season. Going into Q1, some of the most notable Wall Street picks included energy, financials, industrials, and other value-centric sectors that outperformed the preceding 12 months. Few predicted that tech-heavy ETFs like Invesco’s QQQ would be up over 30% YTD and that market breadth would narrow. To be precise, performance for the 2023 market overall was going well until March’s regional banking debacle, which started with Silicon Valley Bank’s collapse and ended with First Republic’s. Money clamored for the well-known tech stalwarts, finding themselves in favor due to their rock-solid balance sheets, and insulation from the banking sector and higher rates. In swift order, we saw the “mega-cap 8” fuel a substantial rally in not only the Nasdaq, but the S&P500 as well.
March was the turning point for breadth and quickly reverted to one of the widest dispersions in performance between the Nasdaq, S&P500, and Dow on record. However, let us not forget higher rates had their impact in 2022 on the speculative and non-speculative growth stocks within the tech sector. With a larger focus on discounted cash flow, 2022 was the year in which only valuation mattered. Cash flow/profits today meant value stocks finally had their day in the sun. Not that Amazon, Microsoft, Google, or Apple didn’t have it. They most certainly had healthy profits, but their valuations going into Jan 2022 were well above historical averages. These multiple contractions from higher discount rates pushed AMZN down 49%, AAPL down 26%, Alphabet down 38%, and MSFT down 28%. These behemoths took the major indexes down with them. Some argue that the broad index’s sell-off could have been far worse had it not been for sectors like healthcare, staples, industrials, and energy. These old economy sectors had been a snooze fest for capital in the previous decade but shined especially bright in a rising rate environment.
As a firm, we view the market through multiple lenses, including but not limited to; the economy & jobs market, equity earnings, fundamental valuation, and technical/sentiment indicators.
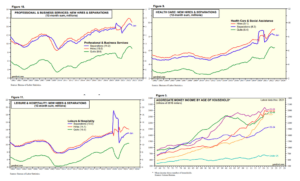
1H 2023 has shown jobs market resilience to an extent few expected. The unemployment rate has been hovering between 3.4-3.7%, with the latest June reading at the mid-point of that range. JOLTS and Non-Farm payrolls, measures of job openings, and monthly job growth have been resilient. The US still has 1.6 job openings for each unemployed person, and June saw Non-Farm Payrolls employment increase by 209,000, slightly below expectations of 250,000, albeit still a strong print. The US economy is 70% consumer spending and is predominantly services based. Many analysts and our clients are wondering when the layoffs will show up in the numbers. Most layoffs appear offset by continued job availability and those switching jobs. With the current technologically driven jobs market, SAF believes that cross-industry movement is occurring more rapidly than ever, driven predominately by these technology skillsets. This ends up netting out and hasn’t resulted in any meaningful change in aggregate demand.
The only weakness seems to be more concentrated in manufacturing, which makes up very little of the overall US jobs market. Although contraction here is often a precursor to recession in traditional economic environments, we find it much less relevant in 2023. Consumers spent freely during the pandemic lockdown on durable/manufactured goods like furniture, TVs, and appliances. Those same spending habits have reverted toward services as lockdowns eased. The increase in the number of retirees is another phenomenon currently impacting the labor force, and many claim it has contributed to the depressed labor force participation rate while being left out of unemployment data. We find this to be net accretive to consumer spending, given that many retirees feel cash and asset rich, allowing them to enjoy their golden years. With increasing interest rates, they also earn substantial interest on their investment portfolios and emergency reserves. Further, this phenomenon should be additive to padding corporate profit margins as senior employees are replaced with juniors at lower salaries.
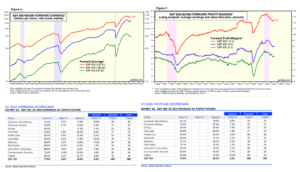
Economic indicators within manufacturing and non-manufacturing/services, as measured by the diffusion indices of ISM’s Purchasing Managers Index (PMI)s, show two very different pictures. This same story is present with the Conference Board Leading Economic Indicators and Coincident/Lagging Indicators. PMIs represent a percentage of survey respondents of purchasing managers within manufacturing and non-manufacturing firms indicating expansion or contraction in purchasing inputs. A level over 50 means that more than 50% of respondents are growing their purchases of inputs.
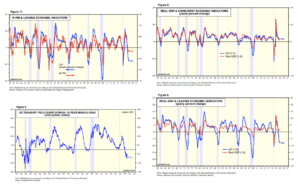
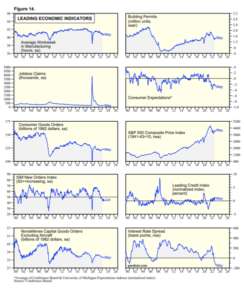
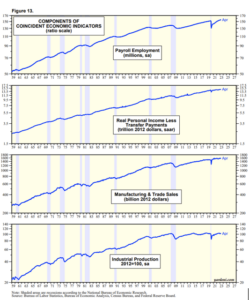
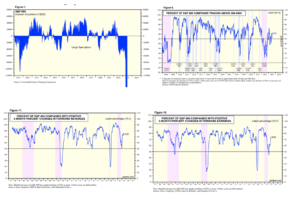
Reviewing the above figures tells a bifurcated story. We have never experienced such a consecutively negative reading on the LEI without it leading to recession (recessions indicated by the grey bars). The same can be said for the profoundly inverted yield curve, which is often quoted as the relationship between the 2-year and 10-year rates. This is one of a few components of the LEIs, along with earnings growth, manufacturing, and durable goods spending. As stated previously, understanding the components of the LEIs is incredibly important to contextualize why we might experience a mild rolling recession that doesn’t end up contracting the entire US economy and market in aggregate. With pandemic distortions on consumer spending habits, it is just as likely these traditional indicators will not result in a recession for the 2023 market. The components for this are highlighted in the charts below. Until we see a significant rise in unemployment, a decline in Manufacturing & Trade Sales, and a contraction in Real Personal Incomes among other things, a recession as defined by the National Bureau of Economic Research (NBER) will remain non-existent.
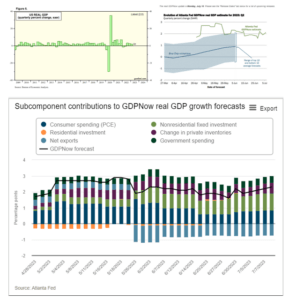
Something else noteworthy is the changes to Real GDP (rGDP) growth. In 2022 we had two-quarters of negative rGDP in Q1’ and Q2’, which is the classical definition of a recession. The long and short of it is that we had a massive shift in consumer spending habits all at once, which distorted these traditional measures of GDP. Yes, how much can be blamed on pandemic-induced consumer spending behavior is unbelievable. This, along with resolved supply chain log jams, meant inventory builds and imports detracted well over 1-2% from headline rGDP. If neither distortion occurred, we would have been positive for all of 2022. We briefly discussed this in an article, “Recession or No Recession for 2023?”. Q1 of 23’s latest and final revision occurred the week ending June 30, with an increase of 2% QoQ vs the original estimate of 1%. On top of this, Q2’s estimate is shown below by the GDP Now projection released by the ATL Fed of 2.3%.
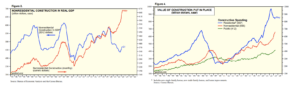
Although we have had a few quarters of below-trend growth, yet another sign found at the beginning of a late cycle leading into potential contraction, it is more likely in our opinion that we might be bottoming and either shifting back up or finding support at a more normal level of growth for the US 2023 economy. A pickup in residential fixed investment, a resurgence in single and multi-family home building, and better-than-anticipated consumer spending further support this reacceleration. Housing is another area this firm doubted was going to contract meaningfully and has been showing signs of bottoming/reaccelerating. This is unsurprising when the existing home market is virtually non-existent, leaving only new constructions to service the growing housing formations from Millennials and Gen-Z. Who wants to get rid of their 3% mortgage unless you move from high-cost cities or states and are equity rich?
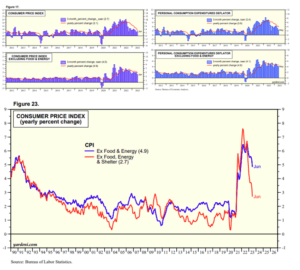
The elephant in the room is the core inflation rate and the Fed’s response. The Fed’s response and attractive money market yields are the principal reasons we find maintaining a healthy cash sleeve compelling. We are paying close attention to both Personal Consumption Expenditures (PCE) and Consumer Price Index (CPI), two different measures of inflation. PCE is the Fed’s preferred gauge as it focuses more on the true impact on consumers’ pocketbooks. Headline CPI and PCE, which contain all components, show promising progress. It is important to note that consumers live in a headline inflation world, no matter how you disaggregate the data. Core CPI and Core PCE strip out commodities and have yet to budge meaningfully apart from this latest June 2023 economy measure. These methods still include rent of shelter, owners’ equivalent rent, and housing, which kept these inflation gauges higher than expected. With data on housing often the most lagging measure, it is often further disaggregated along with commodities to isolate services inflation. This measure, referred to as Core CPI ex-housing or Super Core, looks far better in the battle to control inflation. The main concern for us is the 2023 housing/rental market appears to be bottoming. For only four US cities, buying is more affordable than renting. This could shut a lot of new households out of home ownership and cause broad rent measures to rise again from a resurgence in demand.
Consequently, this could be a problem for the shelter component of inflation and cause the Fed to rethink excluding it when considering a policy response. We still believe that much of the population has insulated themselves from this part of CPI and will continue to spend as a result. So, does this continue to pressure the Fed to hike rates, putting further pressure on equity and bond markets?
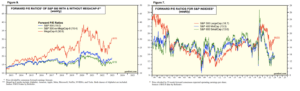
Monetary policy and its projected terminal rate over the past six months have fluctuated by over 1.5%+. Going into the January 23’, projections for Dec/January 24’ policy rates were around 4.5%, with March’s regional banking concerns dropping to as low as 3.75-4% and ending as high as 5.35-5.5% the week ending July 14. Much of this seems to be driven by a lack of a meaningful response by the labor market, core inflation, and capital markets. Consequently, the debate continues whether monetary policy is sufficiently priced into equity and bond markets. Many analysts disagree with the Fed’s consensus that monetary policy operates with long and variable lags and frequently adjust their equity price targets. We find ourselves somewhere in the middle. Treading carefully through this environment is warranted and could put further pressure on equity earnings, valuations, and consumer health, particularly as corporate bond issuance picks up. This is part of why we have chosen to avoid smaller companies that need access to debt to finance growth and operations. However, due to wide concern around many of these points highlighted above, we believe that many firms can, and did, insulate themselves from this higher cost of capital. More specifically by extending their term structure of debt out far into the future in 2020 and 2021, while rates were much lower.
Another significant driver worth paying close attention to is companies’ earnings and valuations. When measured outside the market cap-weighted S&P500, valuations look far more reasonable and closer to the trailing 10yr avg fwd P/E of 16x. More specifically, mid-caps have found themselves far lower in valuation vs. history, and part of the reason we have chosen to overweight them.
Historically, companies typically set the bar lower for themselves to improve their odds of beating expectations. As for earnings, mid and large caps look to be forming a bottom and revising upward. The same can be said for profit margins, a huge driver of valuations and stock performance. Remember that these are projections, regardless, it is encouraging to see. Particularly following last quarter’s earnings beat rate of 77% vs long run avg of 66.3%, and revenues coming in at 74% vs 62.1%. These numbers have instilled much more confidence in our overweight towards US equities.
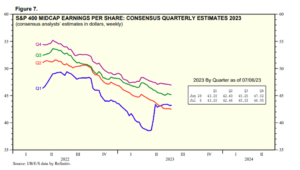
With Q1 2023 completed, this Investment Committee will look toward Q2 for any indication of better-than-anticipated strength. Given the hefty multiple expansion and price performance for the mega-cap 8, they will have high expectations to beat both forward four-quarter guidance and the recent quarter ending June 30. Very little positivity appears in price and valuation for the rest of the 2023 market. There has been some recent broadening in capitalization and sector performance in the past month, but nothing substantial. Some view this as a net negative given markets are often efficient, and the price reflects future expectations. We largely agree that markets are efficient and put faith in price trends. However, we like the odds of a favorable price response going into Q2 earnings results given stock prices broadly haven’t priced in much good news. It would be more concerning if price performance and market euphoria were widespread during this past quarter’s earnings season, pricing in perfection for Q2. As mentioned previously, companies usually err on the side of setting the bar low. Companies are punished far more for meeting or missing expectations in an environment like this and have a powerful incentive to be realistic with their targets. Thus, we are looking for a similar outcome in the Q2 line upwards as in Q1. As you can see, estimates were worsening within a few days/weeks before the start of earnings season. See figures 2 & 7 below.
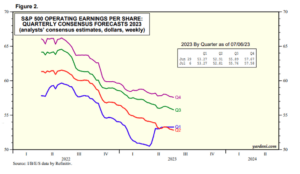
Fiscal spending over the past 12 months will also largely be a boon for revenues, earnings, and the overall economy. This spending will have a material impact as it continues to enter the real economy. Trillions of dollars have poured into consumer savings accounts, banks’ and companies’ balance sheets, and billions have entered non-residential construction and infrastructure development. Just to put things into perspective, we have had the Infrastructure and Jobs Act (1.2T), The Inflation Reduction Act (500b), The Chips Act (100b), and the American Rescue Plan (1.9T). The last predominately showed up in excess savings for consumers. Still, a lesser-known impact had been the 350 billion sent to municipalities with the contingency of those dollars to be spent by 2025 on public works projects and infrastructure improvement. This is offsetting a lot of the Fed’s work in slowing down the economy to decrease inflation. To get a taste of the impact, see Figures 2 & 4 below.
Another big driver of corporate profit margins is the cost of labor, the largest component of the cost of goods sold or “COGS.” The labor market is experiencing a larger than normal amount of retirements, given the aging baby boomer demographic reaching retirement age. As highly paid senior employees are replaced with more junior employees at substantially lower salaries, this should be helpful in corporations maintaining or reducing their cost of labor, even despite wage growth remaining in the 4% range. Note that the below graphs represent the largest percentage of the US labor and equity market. This demo represents a strong part of the demand function for goods, specifically services. Higher interest rates, Required Minimum Distributions (RMDs), and more portfolio income improve portfolio survivability and spending power, especially now that the fixed income and cash is more than keeping up with the inflation rate.
Last but certainly not least, we thought we would provide a brief overview of sentiment and some technical aspects we are watching as we head into the second half of 2023. Going into Q1, there was a lot of institutional and retail negativity shown in both surveys and portfolio positioning. Traditionally, this has been a reliable contrarian indicator of good returns to follow. We see this in the futures market via the Commitment of Traders report below in Figure 1, showing short positions on the S&P500. Obviously, with it being off the chart, we could more confidently say that a lot of bad news may already be reflected in equity values. This isn’t surprising to us given the financial media has been discussing an imminent recession for well over 12 months now. Another sign that we have yet to hit any widespread euphoria in markets is the limited performance breadth in equities, represented by % of companies trading above their 200-day moving average. We are sitting about the midpoint in Figure 6, and it appears we are returning to the levels achieved pre-regional banking crisis. A more fundamental breadth indicator, instead measuring breadth of favorable earnings and revenue growth, is also showing promising positive moves. Once again, this is more convincing to us that we are seeing an actual fundamental improvement in profits that is wider in breadth than the broader measures of price performance. This should mean that most stocks have a higher buffer of safety imbedded in price/valuation, of course, apart from some of the mega-cap eight and other tech stocks.
To recap, here are the main things in the 2023 economy that we will be watching over the next six months:
- Inflation, particularly measures of Core coming down and the Feds verbiage and reaction function to said inflation
- Unemployment and weekly claims
- Earnings and profit margins
- Yield Curve and interest rates
- Economic/capital markets health and corporate bond issuance
Bottom Line:
The ultimate question we seek to answer is whether inflation can come down meaningfully without a widespread recession caused by the Fed. It is easy to make the case that we are not in a recession. Although headline inflation has come down meaningfully, a lot of it has been driven by goods disinflation. Core and specifically services inflation looks to be far stickier. This could be good for profits but bad for the monetary response by the Federal Reserve.
Reasons we believe this is possible:
- Core Ex-Housing has already been decelerating meaningfully. This will isolate services inflation.
- PPI has been decelerating even faster than headline CPI or PCE. This could be both good for companies because they can protect margins (or even improve) even as inflation declines for the goods they sell to consumers.
- Supply chain issues have been resolved; the goods/commodities component will continue to detract; the weaker China recovery should continue to compound this weakness as they encompass a large % of the demand for commodities.
- Consumer excess savings rates are declining in a hurry. This doesn’t mean consumer spending falls off a cliff. It simply means a return to normalcy should be sooner rather than later. We believe the baby boomer generation could pick up the slack here.
Reasons for Concern:
- It appears much of the population has been able to insulate themselves from higher rates. The same could be said for a lot of large-cap firms. This could mean that much higher rates are needed to curtail aggregate demand to the extent that it keeps inflation elevated. This also raises the discount factor for future earnings and could potentially mean that valuation contraction returns.
- Housing, previously thought to be a detractor from future CPI, could bottom and begin adding to the overall inflation component. This makes up over 30% of the overall basket.
- Rising corporate debt issuance could be a problem for smaller or more capital-intensive firms as maturities must be refinanced. We are looking at the sectors and industries with a higher amount of debt maturing in the coming 12-18 months.
- A broader conflict arises from the Russia-Ukraine war that drives back up commodities prices and creates other disastrous knock-on effects.
Wealth is built through informed decisions and strategic financial planning. Schedule a personal consultation with our team of expert advisors today.

Sources:
https://www.bls.gov/news.release/empsit.nr0.htm
https://www.bls.gov/charts/job-openings-and-labor-turnover/unemp-per-job-opening.htm
https://www.yardeni.com/pub/ecoindlei.pdf
https://www.atlantafed.org/cqer/research/gdpnow
https://www.yardeni.com/pub/infltrus_bb.pdf
https://www.cmegroup.com/markets/interest-rates/cme-fedwatch-tool.html
https://www.redfin.com/news/rent-vs-own-2023
https://www.yardeni.com/pub/mag8.pdf
https://lipperalpha.refinitiv.com/2023/06/this-week-in-earnings-23q1-june-30-2023/
https://www.yardeni.com/pub/peacockfeval.pdf
https://www.yardeni.com/pub/ecoindconssp.pdf
https://www.yardeni.com/pub/commit.pdf
https://www.yardeni.com/pub/breadth.pdf