


2016 Recap
2016 is set to go down as one of the most eventful years for investors since the global financial crisis. It was a crazy ride, and the surprises came from everywhere. The vote in the UK – the “Brexit” – shocked the world, as did the outcome of the U.S. presidential election, when Donald Trump defied the odds and the polls and rolled to victory. Stocks in the U.S. opened 2016 with the worst two-week performance in history, only to finish the year with the S&P 500 up more than 9.5% and the global stock market not far behind. However, most of the year’s gains came after the U.S. election, when expectations of better economic growth, lower corporate taxes, and less regulation pushed the market to new all-time highs. Is the market getting ahead of itself? We’ll have to wait and see.
It certainly isn’t cheap. At present, the S&P 500’s next 12 months’ Price/Earnings multiple, a measure of stock market valuation, stands at 16.9x. This represents a nearly 17% premium to the 10-year average P/E of 14.4x. Bonds aren’t cheap either. Perhaps the greatest bull market in bonds ever likely ended in 2016 when the yield on a 30-year Treasury bond hit an intra-day low of 2.088% one day in July. The yield on the 10-year Treasury note hit 1.36% in July as well. This was the lowest closing yield ever for 10-year paper in the U.S., and those notes have been trading here sin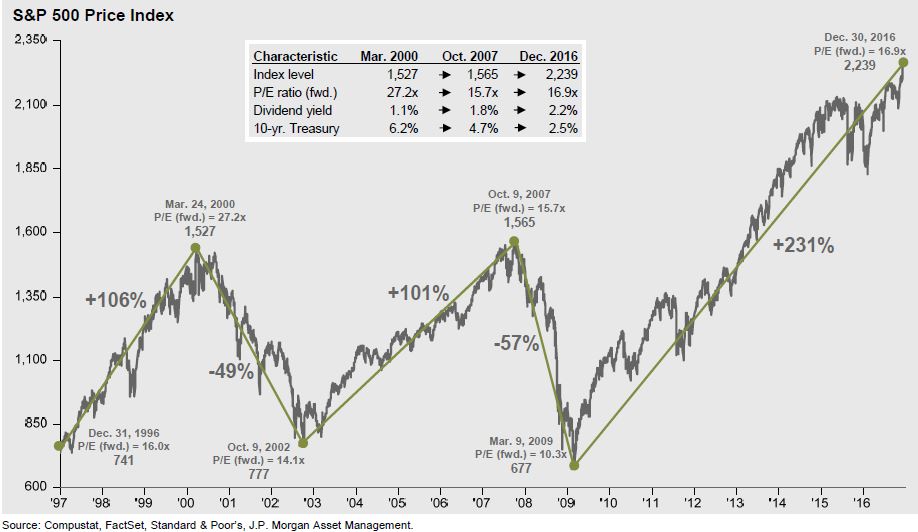 ce 1790. In fact, global interest rates fell to 5,000-year lows during the year as central bank purchases of financial assets topped $25 trillion and the amount of negatively-yielding global bonds surged to $13.3 trillion. Central bank actions during the last several years have impacted (see “manipulated”) the prices of most of the world’s capital market assets. Who knows how these monumental, long-term trades will unwind. We’ll just have to wait and see … and expect more surprises … if that’s possible.
December Recap
After the U.S. election outcome and strong economic data helped propel U.S. stocks upward by more than 3% in November, stocks continued their climb in December. December’s gains were more broad-based however, as developed international stocks joined the party, climbing more than 1.6% during the month. While U.S. and international stocks faded a little in December’s final trading days, optimism abounded among U.S. investors and consumers as the year closed out, and for good reason. Third-quarter U.S. GDP was revised upward to a 3.5% annual growth rate, and U.S. housing prices climbed to a record level, returning above their previous peak set in July 2006, before the housing market went bust.
Even as European stocks advanced during the most festive month of the year, there may be some trouble ahead for the continent. Italian voters rejected a constitutional referendum that some hoped would stabilize the nation’s legislative structure and pave a pathway for helping Italy’s troubled banks. However, after the country’s third-largest bank failed to raise sufficient capital from investors to remain solvent on its own, the Italian government authorized the creation of a bailout fund to step in and provide sufficient liquidity. Also last month, the European Central Bank extended its economic stimulus program until December 2017, six months longer than what many observers had expected, because economic growth wasn’t meeting projections.
As expected, the U.S. Federal Reserve raised its benchmark interest rate by 0.25 of a percentage point at the conclusion if its two-day meeting in mid-December, the Fed’s first rate hike in a year. Before that, the last rate hike was in 2007. The meeting’s only real surprise was the Fed’s change in its forecast for the number of rate hikes it expects to make in 2017, from two up to three. The hike weighed on capital markets around the world. U.S. bond prices fell initially but stabilized later in the month. The U.S. dollar surged on the news, while the Euro, the Yuan and gold all tumbled.
Expectations for the New Year
So, what’s in store for the markets in 2017? Of course, no one knows for sure, and a review of last year’s predictions for 2016 by the “experts” leaves one hesitant to predict anything as very few prognosticators got things right. However, as we embark on a new year, it can be a constructive exercise to consider the lay of the land and get a feel for which way the winds are blowing.
Some argue there are plenty of reasons that capital markets should keep making gains, and for economies to keep growing. Others point to a pretty compelling list of reasons why the music could stop, and soon. Let’s take a look at both sides.
Market “bulls” point to:
- Fiscal stimulus is on its way. This argument is pretty straight-forward. President-Elect Trump ran on a platform of increased fiscal stimulus (government spending) to help keep the economy growing and to create jobs. Trump wants to increase spending on infrastructure projects to build and repair roads and bridges, and he also wants to spend on the military. With both the Senate and the House of Representatives in Republican hands, Trump should have little problem getting increased infrastructure legislation through Congress. Most Democrats are in favor of much of this sort of spending anyway.
- Trump – a businessman in The White House. Trump’s administration is expected to be more “pro-business” than President Obama’s, which should mean lower taxes and less onerous regulations – policies helpful for financial, energy, and environmental companies in particular.
- Technology – always a potential game-changer. “Big data” and the “Internet of Things” are expected to be continuing catalysts for all sorts of new products, services, and applications like self-driving vehicles, wearable devices, and robotics. Advances in bio-therapeutics are coming up with new drugs and treatments all the time. Artificial Intelligence (AI) has the potential to help the world in extraordinary ways … and in ways that can be down-right scary.
Market “bears” point to:
- Valuations are lofty and unsustainable long-term. Almost everyone likes seeing the market go up, but it’s important for investors to remember that unless high priced assets are justified by improved earnings, at some point those higher prices are likely to come back down. The recent rapid appreciation in stock prices with no meaningful improvement in earnings has left valuations stretched, with the S&P 500’s forward P/E ratio at 16.9x, well above its long-term average. Another stock price/earnings metric, the Shiller CAPE ratio breached 28x recently. The last two times the Shiller CAPE peaked above 28x were in December 1999 and October 1929. Think about those time periods. Each proceeded a huge collapse in the stock market.

- Domestic earnings growth may be pressured by a strong U.S. dollar. The dollar has reached its highest level in 14 years in the wake of the presidential election, and a strong dollar has traditionally been a headwind for the earnings of large companies with significant international exposure because it makes U.S. exports more expensive. However, recent earnings data has been improving, and 2016’s numbers were greatly influenced by the under-performance of the energy sector.
- The central bank sponsored “easy money” days may be coming to an end. For the first time since 2006, there is likely to be no big easing of monetary policy in the world’s largest and most developed countries. This tailwind for asset prices may be dying down.
- Market euphoria can be a bad sign. Markets typically climb “a wall of worry”, but right now there doesn’t seem to be much of it around, and that alone could be a sign that some trouble may lay ahead. Investor optimism makes sense when you consider that the S&P 500 has been up on a total return basis for eight straight years. The all-time record for consecutive up years is nine (1991—1999), so another year of gains would tie that record. Is the market getting long in the tooth, or is it just breaking out of a long pause? Prior bull markets that saw similar pauses saw big gains in the year after they broke out of the consolidation period. As we close out 2016, we are only six months removed from that breakout.
So, is the glass half full or half empty? There seem to be as many reasons to be optimistic as there are to be wary and doubtful of the markets. In addition to the bear points above, there are also some long-term issues that could weigh on markets over the coming decades. These include massive amounts of sovereign debt held by the world’s largest economies and poor demographics in those countries. The demographic issues could be offset by pent-up spending to a certain degree, especially from the Millennial demographic which will reach peak spending years soon, and there are economists that point to the possibility of growing out of debt problems, at least in part. But long term views don’t fix short-term issues.
Looking Ahead
In times like these, it makes more sense than ever to maintain a cool head (or hire someone that can do so on your behalf) and have a plan in place. We believe a disciplined approach is the best way to navigate through short-term market gyrations. Our investment process is designed to avoid big losses and to profit from trends over the market cycle, which requires a lot of due diligence and even-handed execution. Stay tuned for next month’s edition for an update on jobs, earnings, and President-Elect Trump’s first few days in office.